Wiki article
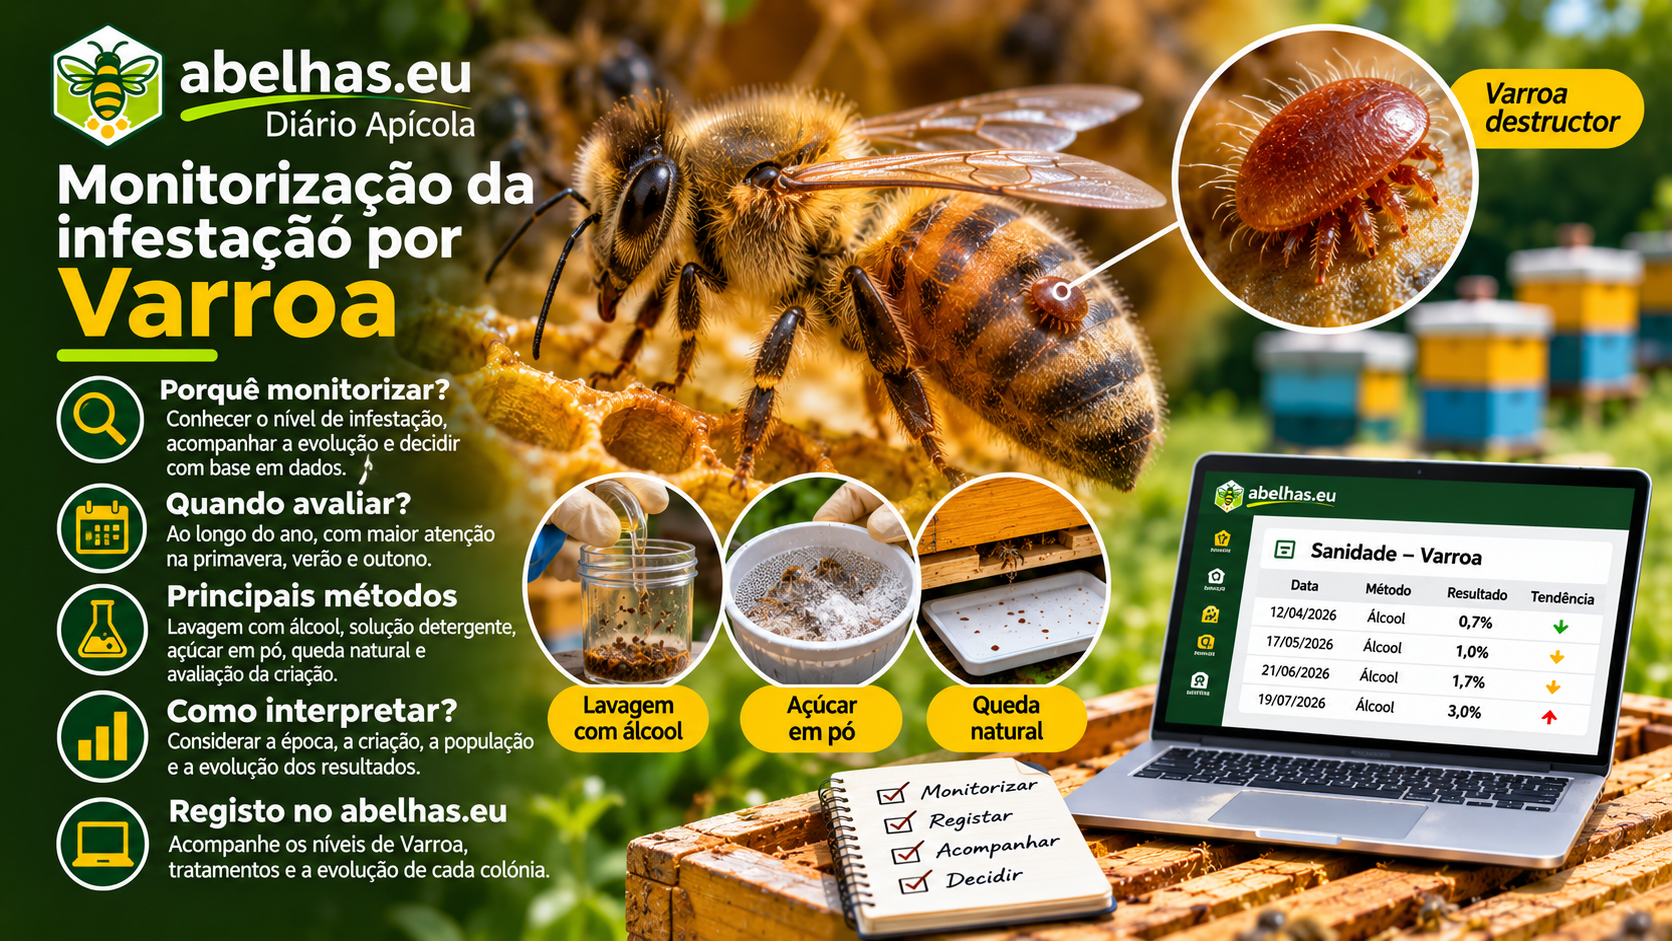
Monitoring Varroa Infestation
*Varroa destructor* is a parasitic mite of honey bees and represents one of the primary threats to *Apis mellifera* colony health.
By Equipa abelhas.eu
Article
Its presence can compromise bee development, facilitate virus transmission, and contribute to colony weakening or loss.
In many regions of Portugal, Varroa is widespread, making monitoring a critical component of health management.
However, the parasite’s presence alone does not determine infestation severity.
The most important step is knowing the infestation level, tracking its progression, and interpreting results in the context of each colony.
1. What Is Varroa destructor?
Varroa destructor is an ectoparasitic mite that feeds on bee tissues, particularly fat body, and reproduces inside sealed brood cells.
Its life cycle is closely tied to bee development.
Adult females can be found on adult bees—typically in the phoretic phase—or inside brood cells, where reproduction occurs.
Before capping, a reproductive female enters a cell containing a larva near the capping stage.
After the cell is sealed, the mite begins reproducing, producing offspring that develop during the bee’s pupal stage.
When the bee emerges, the foundress female and her viable adult offspring may exit the cell.
Reproduction is generally more successful in drone cells due to the longer sealed period.
This relationship between Varroa and brood explains why infestation dynamics vary throughout the year.
2. Why Monitor?
Varroa infestation can rise significantly during intense brood-rearing periods.
High infestation at this stage can compromise colony survival over winter, even with sufficient food stores.
Winter
Brood activity may decrease or stop, depending on the region and weather conditions.
Interpreting results should account for the presence or absence of brood and the monitoring method used.
Avoiding disturbances during cold periods should also influence procedure selection.
Assessment Frequency
As a practical guideline, regular monitoring during active periods—often at monthly intervals—can be adjusted based on risk and health history.
Colonies with high results, suspected reinfestation, or critical periods may require more frequent assessments.
Post-treatment monitoring is important to track infestation trends.
However, no universal schedule fits all operations.
A commonly used sample contains approximately 300 bees, though the number should be known or estimated consistently.
After separating and counting the mites, infestation per 100 bees is calculated.
Formula:
Infestation (%) = (Number of mites / Number of bees sampled) × 100
Example:
In a sample of 300 bees, 9 mites are found.
Infestation = (9 / 300) × 100 = 3%
This result estimates three mites per 100 adult bees sampled.
It does not mean 3% of all colony bees are infested, nor does it directly represent the total mite population.
Advantages:
- Provides a quantitative indicator.
- Facilitates result comparison over time.
- Often used as a reference method in monitoring protocols.
Limitations:
- Requires sacrificing sampled bees.
- Care is needed to avoid collecting the queen.
- Results depend on sample representativeness and procedural execution.
- Does not directly account for mites in sealed brood.
4.2. Detergent Wash
Some protocols use soapy water instead of alcohol.
The goal is to separate mites from collected bees for counting.
Like the alcohol wash, the bee sample is sacrificed.
Efficiency depends on protocol, equipment, and execution.
To compare results over time, consistent procedures are important.
4.3. Powdered Sugar Roll
The powdered sugar roll method aims to dislodge mites from adult bees by applying powdered sugar and gently shaking the sample.
The dislodged mites are collected and counted.
This method may allow bees to be returned to the colony, though it is not without stress, injury, or mortality.
Mite recovery efficiency can vary with humidity, technique, and other factors.
Therefore, results should not be assumed equivalent to those from alcohol washes.
Advantages:
- May avoid systematic bee sacrifice.
- Provides a quantitative estimate.
Limitations:
- Mite recovery can be variable.
- Requires careful execution.
- Humidity and procedural consistency can affect results.
4.4. Natural Mite Drop
This method uses a tray placed under a screened bottom board to collect and count mites that fall naturally from the colony.
The tray remains in place for a known period.
Results are typically expressed as mites per day.
Formula:
Average daily drop = Number of mites collected / Number of observation days
Example:
Over four days, 24 mites are collected.
Average daily drop = 24 / 4 = 6 mites/day
This indicator tracks trends but does not directly correspond to a percentage of adult bee infestation.
Advantages:
- Does not require bee collection.
- Allows trend tracking with minimal disturbance.
- Useful for observing changes after interventions.
Limitations:
- Drop varies with brood quantity, colony activity, and other factors.
- Collection duration affects estimate stability.
- Ants and other organisms may remove mites from the tray.
- Does not allow direct conversion to infestation percentage without additional assumptions.
It is important to distinguish natural drop from drop observed after applying an acaricide treatment.
4.5. Drone Brood Assessment
Inspecting sealed drone cells can reveal reproductive mites and their offspring.
This method provides information on parasite presence and reproduction in brood.
However, results depend on drone brood availability and should not be interpreted as equivalent to adult bee infestation.
It can serve as complementary information but does not necessarily replace other quantitative methods.
5. How to Interpret Results?
One of the most common mistakes is interpreting any infestation value in isolation.
For example, a 3% result does not necessarily mean the same thing in all seasons or colonies.
Assessment should consider:
Time of year: Infestation risk varies with the colony’s annual cycle.
Brood quantity: A significant portion of mites may be in sealed brood.
Adult population: The same number of mites can represent different pressures in colonies with varying populations.
Health status: Virus presence and other health issues can worsen infestation effects.
History: A rising value may warrant attention even if it does not yet seem high.
Previous interventions: It is important to know which treatments were applied, their dates, and observed results.
Are There Reference Values?
Various organizations and technical programs use reference values to guide control decisions, often expressed as mites per 100 adult bees.
However, these thresholds vary by region, season, monitoring method, and health objectives.
A value of 2% or 3%, for example, may be used as a reference in certain protocols, but it should not be interpreted as a universal safety limit or an automatic treatment trigger.
Decisions should consider applicable technical and health guidelines, the operation’s context, and result trends.
It provides the initial infestation level and contextualizes intervention decisions.
After Treatment
It verifies whether infestation has decreased and remains at a level compatible with defined health objectives.
It is important to respect the appropriate assessment interval, considering the product used, treatment duration, and brood cycle.
A high mite drop during treatment shows mites were affected but does not, by itself, prove residual infestation is low.
Evaluating Infestation Reduction
When using comparable measurements before and after an intervention, the observed percentage reduction can be calculated.
Formula:
Observed reduction (%) = ((Initial infestation − Final infestation) / Initial infestation) × 100
Example:
- Initial infestation: 4.0%
- Final infestation: 1.0%
Observed reduction = ((4 − 1) / 4) × 100 = 75%
This value represents the observed reduction between two measurements.
It should not be confused with the product’s pharmacological efficacy, as factors like mite reproduction, reinfestation, brood quantity, and sampling variability can influence results.
Treatments must comply with authorized medicines, usage conditions, and DGAV guidelines.
8. Reinfestation and Differences Between Colonies
Infestation does not necessarily progress the same way in all colonies within an apiary.
Some may show higher levels due to differences in population, brood, hygienic behavior, or exposure to external mite sources.
Reinfestation can occur through phenomena like bee drift and robbing of weakened colonies.
13. Conclusion
Varroa monitoring is a fundamental tool for understanding colony health.
Rather than seeking a single value, it is important to track infestation trends, use consistent methods, and relate results to bee development.
Different monitoring methods have advantages and limitations, so their selection should consider assessment goals and apiary conditions.
Systematic record-keeping allows comparing results, identifying trends, and evaluating interventions over time.
10. What to Record in Each Monitoring?
To track infestation consistently, it is helpful to record information about the method used and observation conditions.
The goal is to provide organized information to support beekeeper decisions, respecting different monitoring and management methods.
12. Common Monitoring Mistakes
Some errors can compromise result interpretation.
Relying only on visual observation: The absence of visible mites does not indicate low infestation.
Comparing different methods: Results from alcohol washes, powdered sugar rolls, and natural drop are not directly equivalent.
Ignoring sample size: Without this information, calculating infestation percentage accurately is impossible.
Assessing only once a year: A single measurement does not track progression.
Overlooking sealed brood: Some mites may be inside cells.
Confusing post-treatment drop with residual infestation: Counting fallen mites does not show how many remain in the colony.
Not recording results: Without records, identifying trends and evaluating interventions is difficult.
Using thresholds without context: Reference values should be interpreted based on method, season, and applicable guidelines.
You cannot manage what you do not measure. Monitoring Varroa turns an invisible threat into useful information to protect colonies.
References and Sources
- Rosenkranz, P., Aumeier, P. & Ziegelmann, B. (2010). Biology and control of Varroa destructor. Journal of Invertebrate Pathology, 103, S96–S119.
- Dietemann, V. et al. (2013). Standard methods for varroa research. Journal of Apicultural Research, 52(1).
- Ramsey, S. D. et al. (2019). Varroa destructor feeds primarily on honey bee fat body tissue and not hemolymph. Proceedings of the National Academy of Sciences, 116(5), 1792–1801.
- Traynor, K. S. et al. (2020). Varroa destructor: A complex parasite, crippling honey bees worldwide. Trends in Parasitology, 36(7), 592–606.
- COLOSS — BEEBOOK: Standard Methods for Apis mellifera Research.
- Direção-Geral de Alimentação e Veterinária (DGAV) — Information on bee health and veterinary medicines: https://www.dgav.pt
- World Organisation for Animal Health (WOAH) — Technical information on bee varroosis: https://www.woah.org
Note: This article is for informational purposes. Varroa monitoring and control should follow applicable health guidelines, local conditions, and authorized veterinary medicines.
Related articles
- Monitoring Varroa with CO₂: How It Works and What Science Says
Monitoring *Varroa destructor* infestation is one of the most critical activities in the health management of honey bee colonies.
- Hive Inspection: What to Observe and Record
Hive inspection is one of the fundamental tasks in beekeeping management. It allows monitoring the colony’s progress, identifying changes in its behavior, and assessing the conditions necessary for its development.